

This year, I wanted to be more proactive about managing my seasonal allergies. Unfortunately, the EU-vide pollen service doesn't cover Estonia, and I needed the data from my closest monitoring station integrated directly into my Home Assistant dashboard. This way, I could build powerful automations and get alerts exactly when required.
Why track allergens?
The thing about allergies is that they're sneaky. Some days you wake up feeling terrible and have no idea why, only to discover later that birch pollen was through the roof. Having real-time allergen data helps me:
- Take antihistamines before symptoms hit
- Decide when to run my air purifier on high
- Avoid outdoor activities during peak pollen times
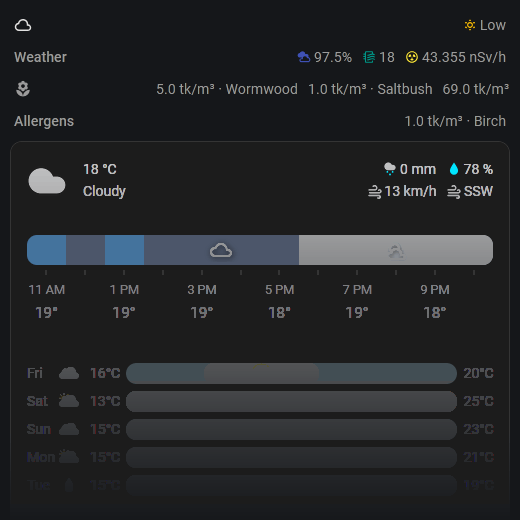
The best part is, it's not just about pollen. The same integration I found also pulls in other important air quality metrics like Particulate Matter (PM2.5), NO₂, CO, and even environmental radiation levels, all from the official Estonian source.
The Solution: A Perfect Integration
Instead of trying to scrape websites or combine different data sources, I found a fantastic HACS integration that does all the heavy lifting: Estonian Ambient Air Quality.
It connects directly to the official Estonian Air Quality Monitoring System (ohuseire.ee), so the data is reliable. It pulls information for air quality, pollen, and radiation from your specific monitoring station.
One of the coolest features is how it handles pollen data. Pollen counts often get published a day late. The integration knows this and will automatically show you the most recent data from the past week, clearly flagging it as "historical," so you're never left guessing. It keeps checking every hour for a fresh update.
Setting It Up
Getting it running is incredibly simple.
- Install via HACS:
- Go to HACS -> Integrations and add a custom repository.
- URL: Here or
https://github.com/zaifkhan/estonian_air_quality - Category:
Integration - Install the "Estonian Ambient Air Quality" integration that appears and restart Home Assistant.
- Configure in Home Assistant:
- Go to Settings > Devices & Services.
- Click + Add Integration and search for "Estonian Ambient Air Quality".
- A dialog will pop up. Just follow the steps to select which data you want (Air Quality, Pollen, etc.) and choose your nearest monitoring station.
That's it! The integration creates sensors for each indicator, like sensor.pollen_tallinn_birch or sensor.air_quality_tallinn_pm2_5 (the name will change based on the station you picked).
Dashboard That Doesn't Clutter
I don't need to see pollen counts all year round, so I use a conditional card in my dashboard that only appears when pollen levels are high enough to be a problem.
Here's an example that shows an alert card only when birch pollen is moderate or high (let's say above 20 tk/m³).
type: conditional
conditions:
  - entity: sensor.pollen_tallinn_birch
    state_condition:
      - condition: numeric_state
        above: 20
card:
  type: entities
  title: "⚠️ Allergy Alert"
  entities:
    - entity: sensor.pollen_tallinn_birch
    - entity: sensor.pollen_tallinn_alder
    - entity: sensor.pollen_tallinn_grasses
Conditional card example for dashboard
This way, my dashboard stays clean when everything's fine but immediately warns me when I need to pay attention.
Practical Automation
The real power comes from automation. My favorite one sends a notification to my phone on mornings when the pollen forecast is high so that I can prepare for the day.
This automation triggers at 7:00 AM and checks if the birch pollen level is over a certain number (e.g., 50).
automation:
  - alias: "Morning Birch Pollen Alert"
    trigger:
      - platform: time
        at: "07:00:00"
    condition:
      # Only run if birch pollen is high
      - condition: numeric_state
        entity_id: sensor.pollen_tallinn_birch #<-- Change to your sensor
        above: 50
    action:
      # Send a notification to my phone
      - service: notify.mobile_app_your_phone_name #<-- Change to your device
        data:
          title: "High Pollen Today!"
          message: >
            Birch pollen is at {{ states('sensor.pollen_tallinn_birch') }} today.
            Time to take an antihistamine!
Example YAML for creating an automation
I've also set up my air purifier to automatically ramp up its fan speed when indoor air quality drops or outdoor pollen levels spike. The possibilities are endless!
Future improvements
I've been thinking about the next steps for this integration. One frustrating thing I've noticed is that the provider's data is often delayed, sometimes by a day.
Here's what I plan: instead of just showing current levels, I want to make the integration predict allergen levels for the coming days. The idea is to use local weather forecasts, particularly wind and rain data, to forecast pollen movement and concentrations. Maybe some simple prediction models could be used to calculate a predicted risk factor.
Here's my thinking:
- Strong winds typically carry more pollen
- Rain washes pollen out of the air temporarily
- Dry, sunny days after rain often lead to pollen spikes
- Temperature patterns affect when plants release pollen
Another thing to do is make the integration work out of the box with pollenprognos-card so that users can get an out-of-the-box Lovelace card for their dashboard.
Note: This integration uses publicly available data, which might not be 100% accurate for your specific location and is not affiliated with the official Estonian Environmental Research Centre.